The Performance Attribution Report helps you determine how your asset allocation and selection of securities affects your portfolio’s performance when compared to the performance of the S&P 500 Index.
To run a Detailed PDF Report with the Performance Attribution Report, set up your Detailed PDF Report as you normally would, and select Performance Attribution in the Select Report(s) section of the page.
The first part of the Performance Attribution Report contains two tables:
This table shows how your portfolio is allocated among ten different sectors, cash and unclassified (anything not included in one of the other sectors), and how that allocation compares to the S&P 500 Index. The table has three parts: Beginning Weight, Ending Weight and Average Weight.
These tables show the beginning, ending and average weight for each sector in your portfolio and the S&P 500, and the difference (positive or negative) between the two, represented by a percentage. You can use this table to see how under or overweighted your portfolio is in each sector compared to the S&P 500.
This table lets you compare your returns in each of the ten sectors, plus cash and unclassified, to those of the S&P 500, and view the attribution effects of your sector allocation and stock selection within each sector. Attribution effects let you see why your returns in a particular sector were better or worse than those of the S&P 500.
The Period Return part of the table shows the absolute return percentage for each sector in your portfolio and for the S&P 500, and the difference (positive or negative) between the two.
The Contribution to Return part of the table measures the contribution of each sector to the overall return. The table also illustrates the contribution of return for the account of each sector versus the S&P 500. The standard calculation used to derive the Contribution to Return is:
Period Return x Beginning Weight = Contribution to Return
The attribution effect part of the table shows the attribution effects of sector allocation (Allocation column), the attribution effects of security selection within each sector (Selection column), and the total attribution effects for the period of the report. The attribution effect dissects the return and illustrates the reason for your outperformance or underperformance.
The allocation effect determines whether the overweighting or underweighting of sectors relative to a benchmark contributes positively or negatively to the the account’s return. Positive allocation occurs when the portfolio is overweighted in a sector that outperforms the benchmark, and underweighted in a sector that underperforms the benchmark.
The selection effect measures the account’s ability to select securities within a sector relative to the benchmark. A positive selection will occur if the account made better stock selections within the sector compared to the benchmark.
The second page of the Performance Attribution Report shows two charts:
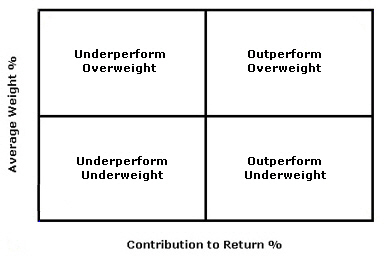
The third page of the Performance Attribution Report displays a scatter plot that shows average weight versus percent contribution return for each sector plus cash and unclassified. The scatter plots lets you see at a glance how your weighting (sector allocation) and contribution to return for each sector compares to the S&P 500 for the period of the return.
There are four quadrants in the scatter plot; each sector is represented somewhere in the four quadrants based on its average weight and contribution to return (both values are taken from the tables on the first page of this report).
The following illustration shows how to interpret the scatter plot results; depending on the quadrant in which each sector appears, its average weight percent and contribution to return percent either under- or overperformed the S&P 500 for the period of the report.