Open topic with navigation
Snapshot PDF Reports
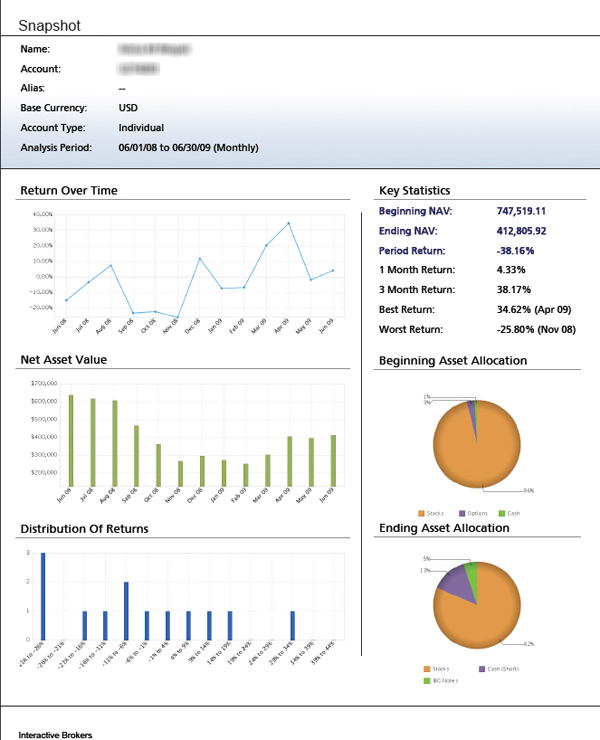
The Snapshot is a one-page report that displays graphs and charts representing an account's return, Net Asset Value (NAV), asset allocation and distribution of returns. The Snapshot gives you a downloadable and printable summary of an account’s performance and is suitable for presentation to advisor and broker clients. Optionally, you can include a benchmark comparison to compare your own performance against an industry standard benchmark or your own custom benchmark.
To create and run a Snapshot PDF report in PortfolioAnalyst
- Click Reports > PortfolioAnalyst.
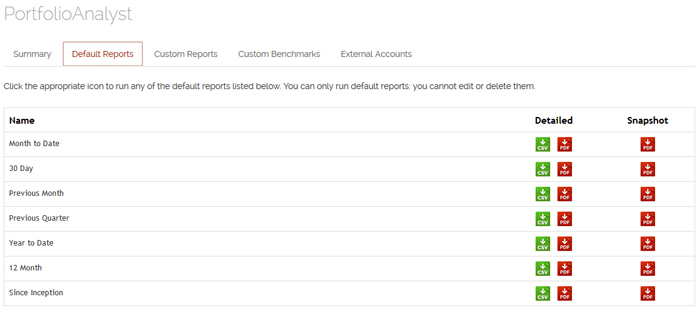
PortfolioAnalyst includes default Snapshot PDF reports. These are displayed on the Default Reports tab, which appears when you first open PortfolioAnalyst. Run these reports or any other in the list by clicking the PDF icon in the Snapshot column of the Default Reports tab.
- Click the Custom Reports tab. This tab lists all of your previously created and saved custom PortfolioAnalyst reports.
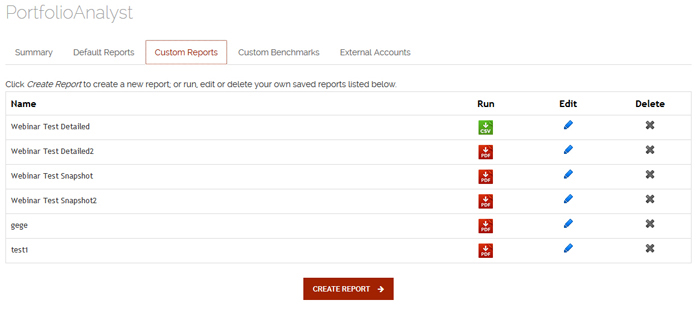
- Click CREATE REPORT.
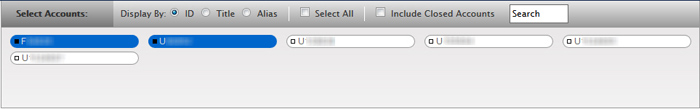
- If you are a Master account user responsible for client or sub accounts or you have multiple linked accounts, select one or more accounts in the Account Selector.
The report settings appear.
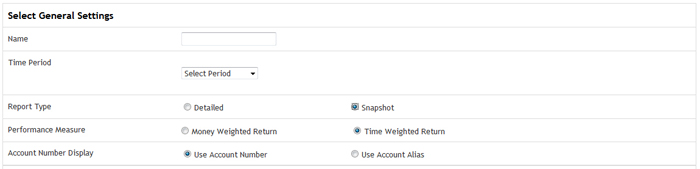
- Type the name of the new report in the Name field.
- If you are a Master account user, the Assign Synopsis button appears. Optionally, assign previously created synopses to the PortfolioAnalyst report:
- Click Assign Synopsis.
- In the Assign Synopsis dialog, select a previously-saved synopsis, select the accounts whose reports to which you want to attach the synopsis, then click Assign. Click Apply to apply your selections.
- Select a time period:
- Select Daily, Monthly, Quarterly, Previous Month, Previous Quarter, Month To Date, Year To Date or Since Inception (since the inception of your account), depending on how you want to view the data.
- If you selected a daily time period, select a starting and ending date (up to a maximum of 60 days) using the calendar popoup. If you selected a monthly time period, select a starting and ending month. If you selected a quarterly time period, select a starting and ending quarter. Click the icons next to the Starting Period and Ending Period fields to pick dates from a calendar.
Analysis results include data available from January 2008 to the present.
- For Performance Measure, select Time Weighted Return or Money-Weighted Return.
- Time-Weighted Return (TWR):Select this metric to view the percent return produced over time independent of contributions or withdrawals. TWR eliminates the impact of the timing of fund cash flows and isolates the portion of a portfolio's return that is attributable solely to the manager's actions. TWR is typically used for public fund managers because they normally do not control cash flowing into or out of their funds.
- Money-Weighted Return (MWR): Select this metric to view the performance of your portfolio during the specified report period. MWR is calculated using the Modified Deitz method and is influenced by the time of decisions to contribute or withdraw funds, as well as the decisions made by the portfolio manager of a fund.
- Select Snapshot as the Report Type.
- Choose how you want your account number to appear on your report in the Account Number Display section:
- Use Account Number: Select this option to include your Account ID on your report.
- Use Account Alias: Select this option to include your Account Alias on your report if you want to hide the actual Account ID.
- If you are an Advisor, Money Manager, Broker, Proprietary Trading Group STL Account Master or you have multiple linked accounts and you have selected multiple accounts in the Account Selector, you have the option of created a consolidated Snapshot report for all of the selected accounts.
- Click the Consolidate check box to create create a consolidated Snapshot report, which includes a single set of data from all of the accounts that you have selected.
- If you select only one account in the Account Selector, click the Consolidate All check box to create a consolidated report which includes a single set of data from all accounts.
- Optionally, you can include a benchmark comparison in your Snapshot report. When you select the Snapshot radio button, the Select Benchmarks section appears.
Select up to three benchmarks from the list of Available benchmarks (including your own custom benchmarks) then click the right arrow button to move them into the Selected list. Select one or more benchmarks using the Ctrl+click keyboard combination. Move benchmarks out of the Selected list by selecting them then clicking the left arrow button.
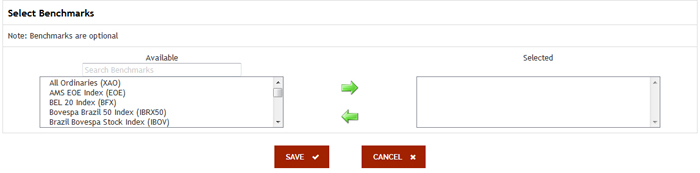
- Click SAVE to save the report. Once you save a report, it will appear in the list of saved PDF reports.
- Click CANCEL to cancel the report.
- View the report by clicking the Run icon in the list of saved reports. Your report appears in a new window.
If there is a negative Net Asset Value during the time period you select for your Snapshot report, the report will not be generated.
The Snapshot includes the following sections:
- Account Information: Displays your account name and number, account alias if you have one, your base currency, account type and the specified time period.
- Return Over Time: Displays a line chart showing the account's return percentage over the specified time period.
- Net Asset Value: Displays a bar chart showing the account's Net Asset Value over the specified time period.
- Distribution of Returns: Displays a bar chart showing the range of return percentage for each day, month or quarter in the specified time period and the number of times the return performance fell within that range for the entire period.
- Key Statistics: Displays several statistics for the specified time period, including beginning and ending NAV, return percentages (depending on your selected time period), the best return and the worst return.
- Asset Allocation: Displays two pie charts, one representing the account's asset allocation at the beginning of the specified time period and one representing the account's asset allocation at the end of the specified time period.
The following example shows a typical Snapshot report.